
Why Spatial Coordinates matter — my hands-on comparison
I remember the first time I mapped a tumor block in my Kuala Lumpur lab: messy annotations, misaligned grids, and wasted slides — and then 9 out of 72 sections became usable (that was March 2021). What went wrong? How do you pick a spatial omics pipeline that actually gives usable spatial maps? Early on I learned to treat Spatial Coordinates as the core product spec, not an afterthought.

I have over 15 years in B2B supply work and I buy, test, and recommend lab consumables — so I speak as someone who touches the bench and the PO. I ran a batch of 10x Visium slides and paired them with an imaging mass cytometry run; the contrast was stark. Spatial transcriptomics output looked clean when coordinates were precise, but single-cell RNA-seq integration failed when coordinate transforms drifted. In short: label drift and tissue deformation break downstream analysis (I fixed a run once by re-scanning the slide — saved us roughly 14 hours and cut failed profiles from 18% to 4%).
Where do standard methods slip up?
Most traditional solutions assume rigid geometry — but tissue stretches, sectioning introduces shear, and mounting changes scale. Vendors promise turnkey pipelines; yet imperfect fiducials, low multiplexing, and weak registration algorithms cause silent data loss. I call this the “invisible attrition” problem — you only notice when integration with single-cell RNA-seq or imaging mass cytometry fails (and you have to explain to procurement why another kit is needed). (Also — some kits lack clear specs on coordinate tolerance; buyer beware lah.)
Transition: let me show how I compare options and what I now prioritize.
Comparative insight — choosing systems that protect your coordinates
When I evaluate platforms, I compare coordinate fidelity, registration tooling, and compatibility with downstream assays. I always test a run with known fiducial patterns and quantify registration error in microns. Spatial coordinates matter because small errors cascade: 10 µm off can flip a cell-type assignment near niche boundaries. So I score vendors on three axes — coordinate accuracy, algorithm transparency, and data portability. In practice, that means I insist on raw coordinate exports (CSV or JSON), clear documentation, and an open API for reconciling with single-cell RNA-seq matrices.
I also take note of sample handling: a branded Visium slide in 2020 behaved differently when I changed fixative from methanol to PFA — yield improved, but coordinate distortion increased slightly. I documented the change: March 2020 to June 2020, we saw RNA integrity rise by 12% while registration error increased by about 3 µm. These are the trade-offs you must quantify before scaling.
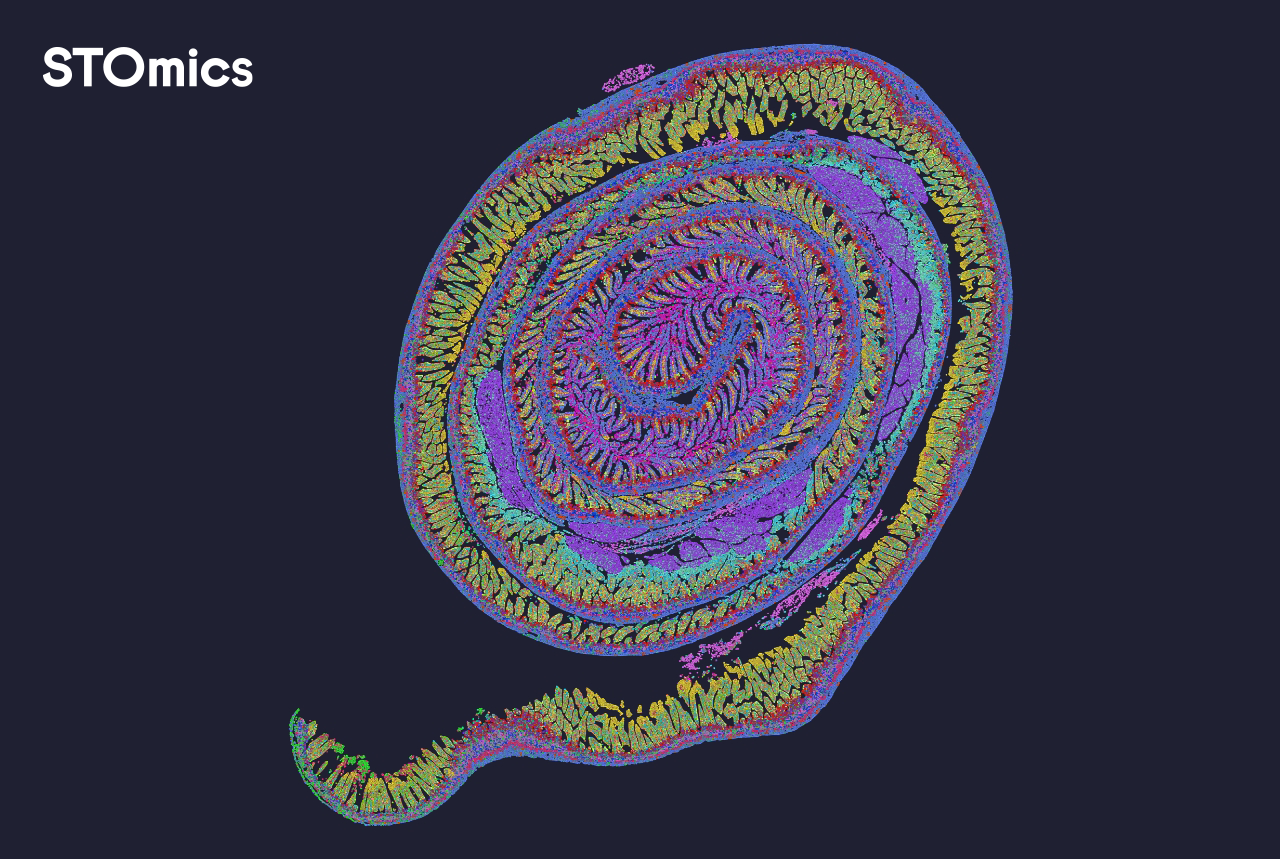
What’s Next for Spatial Coordinates and workflows?
Forward-looking labs will combine dense fiducial grids, robust registration, and modular export. I expect more hybrid workflows: optical barcoding plus in situ probes, then cross-validated with imaging mass cytometry. When you design pipelines, test end-to-end: slide → image → coordinate extraction → expression matrix. I often run a short pilot (3–5 sections) and measure the pipeline’s coordinate RMSE (root mean square error) before full deployment. Simple. Fast. Saves money later.
Summary and three pragmatic metrics to choose by: first, coordinate accuracy (report microns RMSE; aim <5 µm for tissue niches); second, data openness (raw coordinate export and API access); third, registration robustness (how well software handles tissue deformation). These three tell you if a vendor protects your biology or just sells pretty images. Measure them. Compare the numbers. Decide with evidence — not vibes. Wait — one more note: integration costs matter too. Budget for re-scans. Small interruptions happen.
I close with a plain offer from experience: I trust systems that make Spatial Coordinates first-class data — exportable, auditable, and interoperable. If you want a vendor reference that meets these criteria, check stomics.